Case Study
To demonstrate the feasibility of such analysis using the ActionSense data, a preliminary correlational cross-modal investigation was performed between EMG data and tactile sensing data.
For certain tasks such as slicing, it may be expected that each downward stroke induces increased force on the hand holding the knife and uses increased forearm muscle activity to stiffen the wrist and grasp the knife. This is thus a reasonable test case for seeing whether muscle activation can provide information about hand pressure and vice versa. Since slicing is composed of many small repetitive motions, it is also a good case for exploring the possibility of automatic labeling.
Data Processing
The EMG and tactile data streams are first pre-processed to estimate overall activation levels. The absolute value of EMG data across all 8 forearm channels are summed together in each timestep to indicate overall forearm activation; this provides an estimate of wrist stiffness, which is induced by activating the antagonistic muscle pairs, and grasp strength. Similarly, all entries of each 32x32 tactile sensing matrix are summed together to indicate overall force applied to the hand.
The streams are then smoothed to focus on low-frequency signals on time scales comparable to slicing motions. The EMG signal is filtered by a 5th order Butterworth filter with cutoff frequency 0.5 Hz. The tactile stream is smoothed by a moving mean filter with a 1 second trailing window. After these filters, each stream is normalized such that its values are between [0, 1].
While the EMG stream is sampled at approximately 160 Hz, the tactile data is sampled at approximately 6 Hz by the current infrastructure. To facilitate analysis, the EMG stream is resampled to the timestamps recorded by the tactile stream.
Finally, the ground-truth labels and associated timestamps are used to segment the EMG and tactile streams to focus on the desired activities. Each one is cut to start when the first instance of the desired task commences, and end when the last instance of the desired task concludes. It may thus include intermediary activities such as clearing the cutting board if subjects chose to do so in between task iterations, but this is sufficient for the current preliminary exploration.
Results

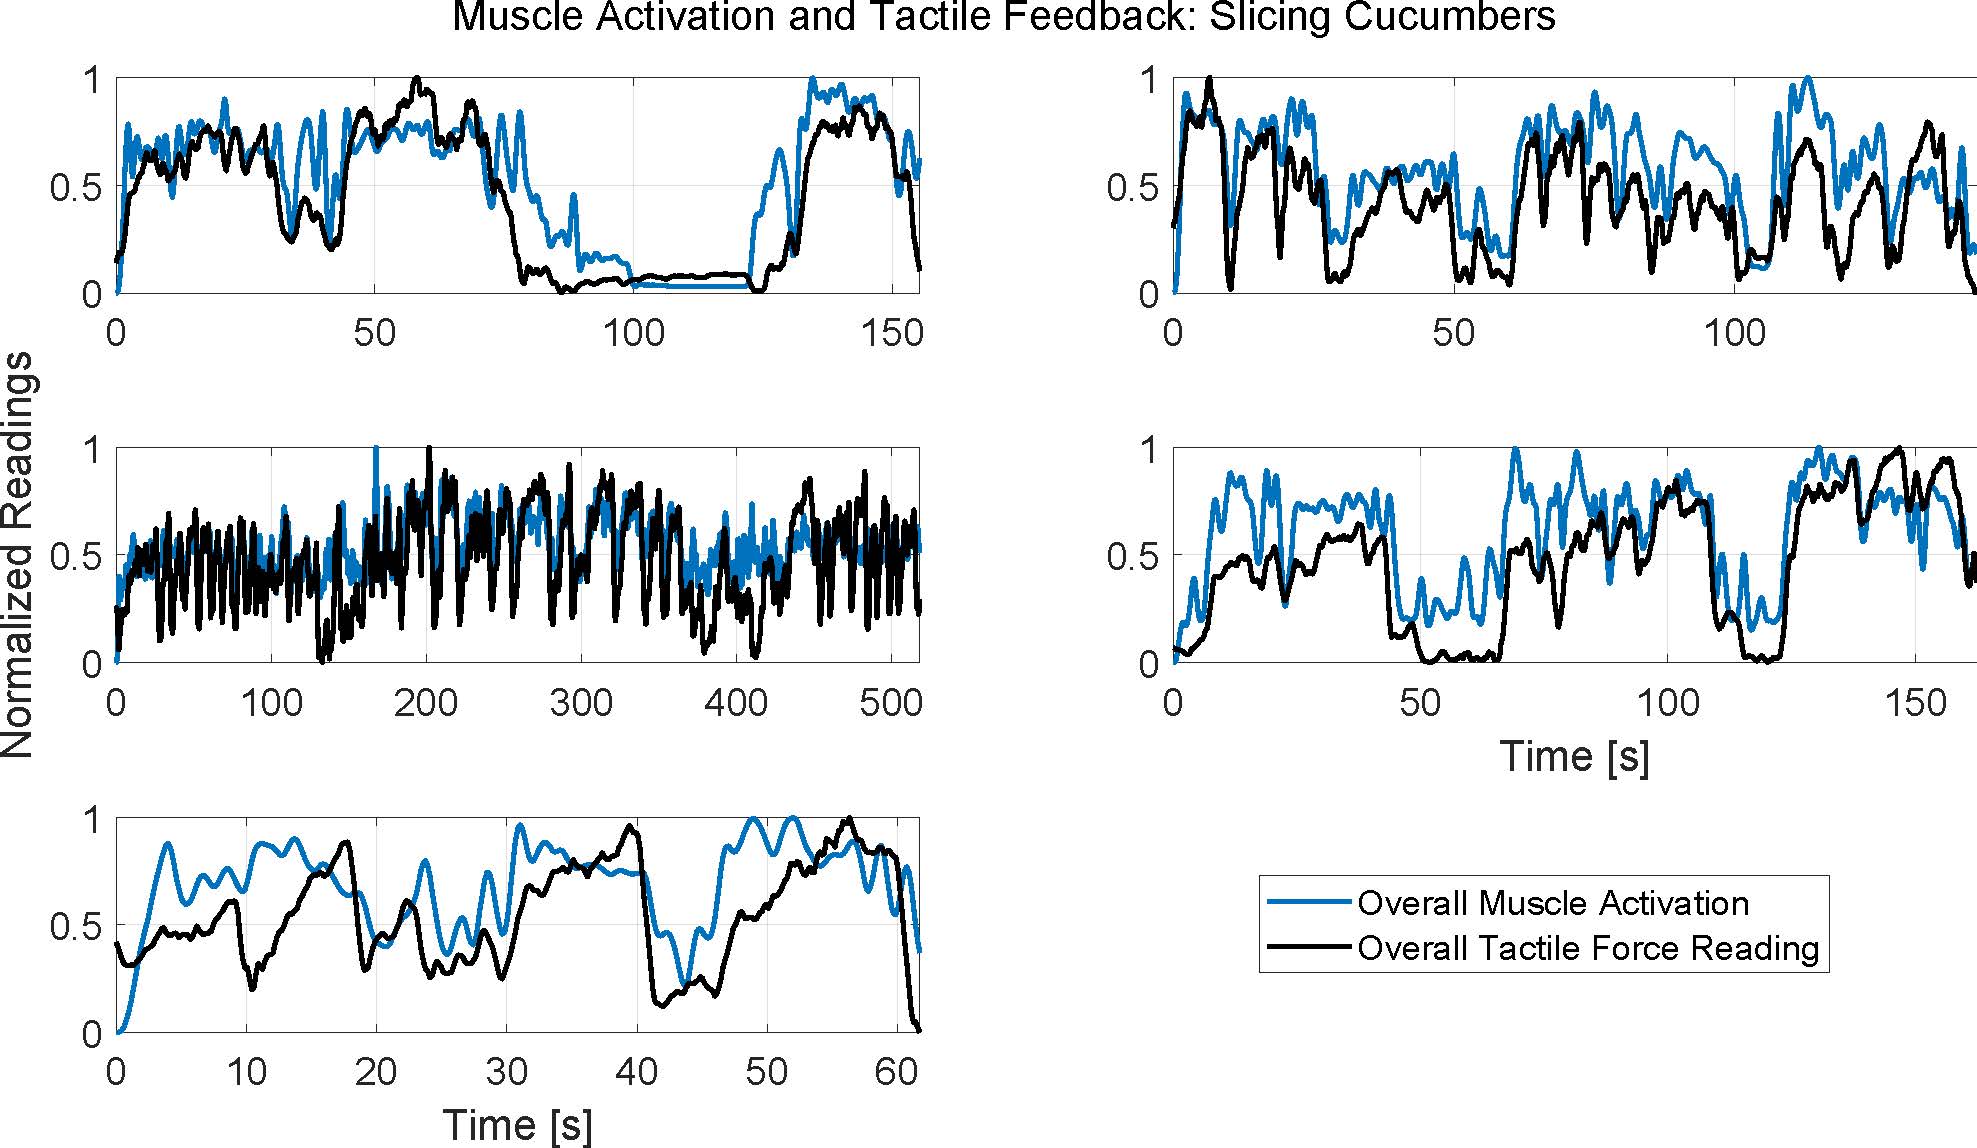
Each subplot represents data from a different subject. Three cucumbers were completely sliced during the duration of each subplot.

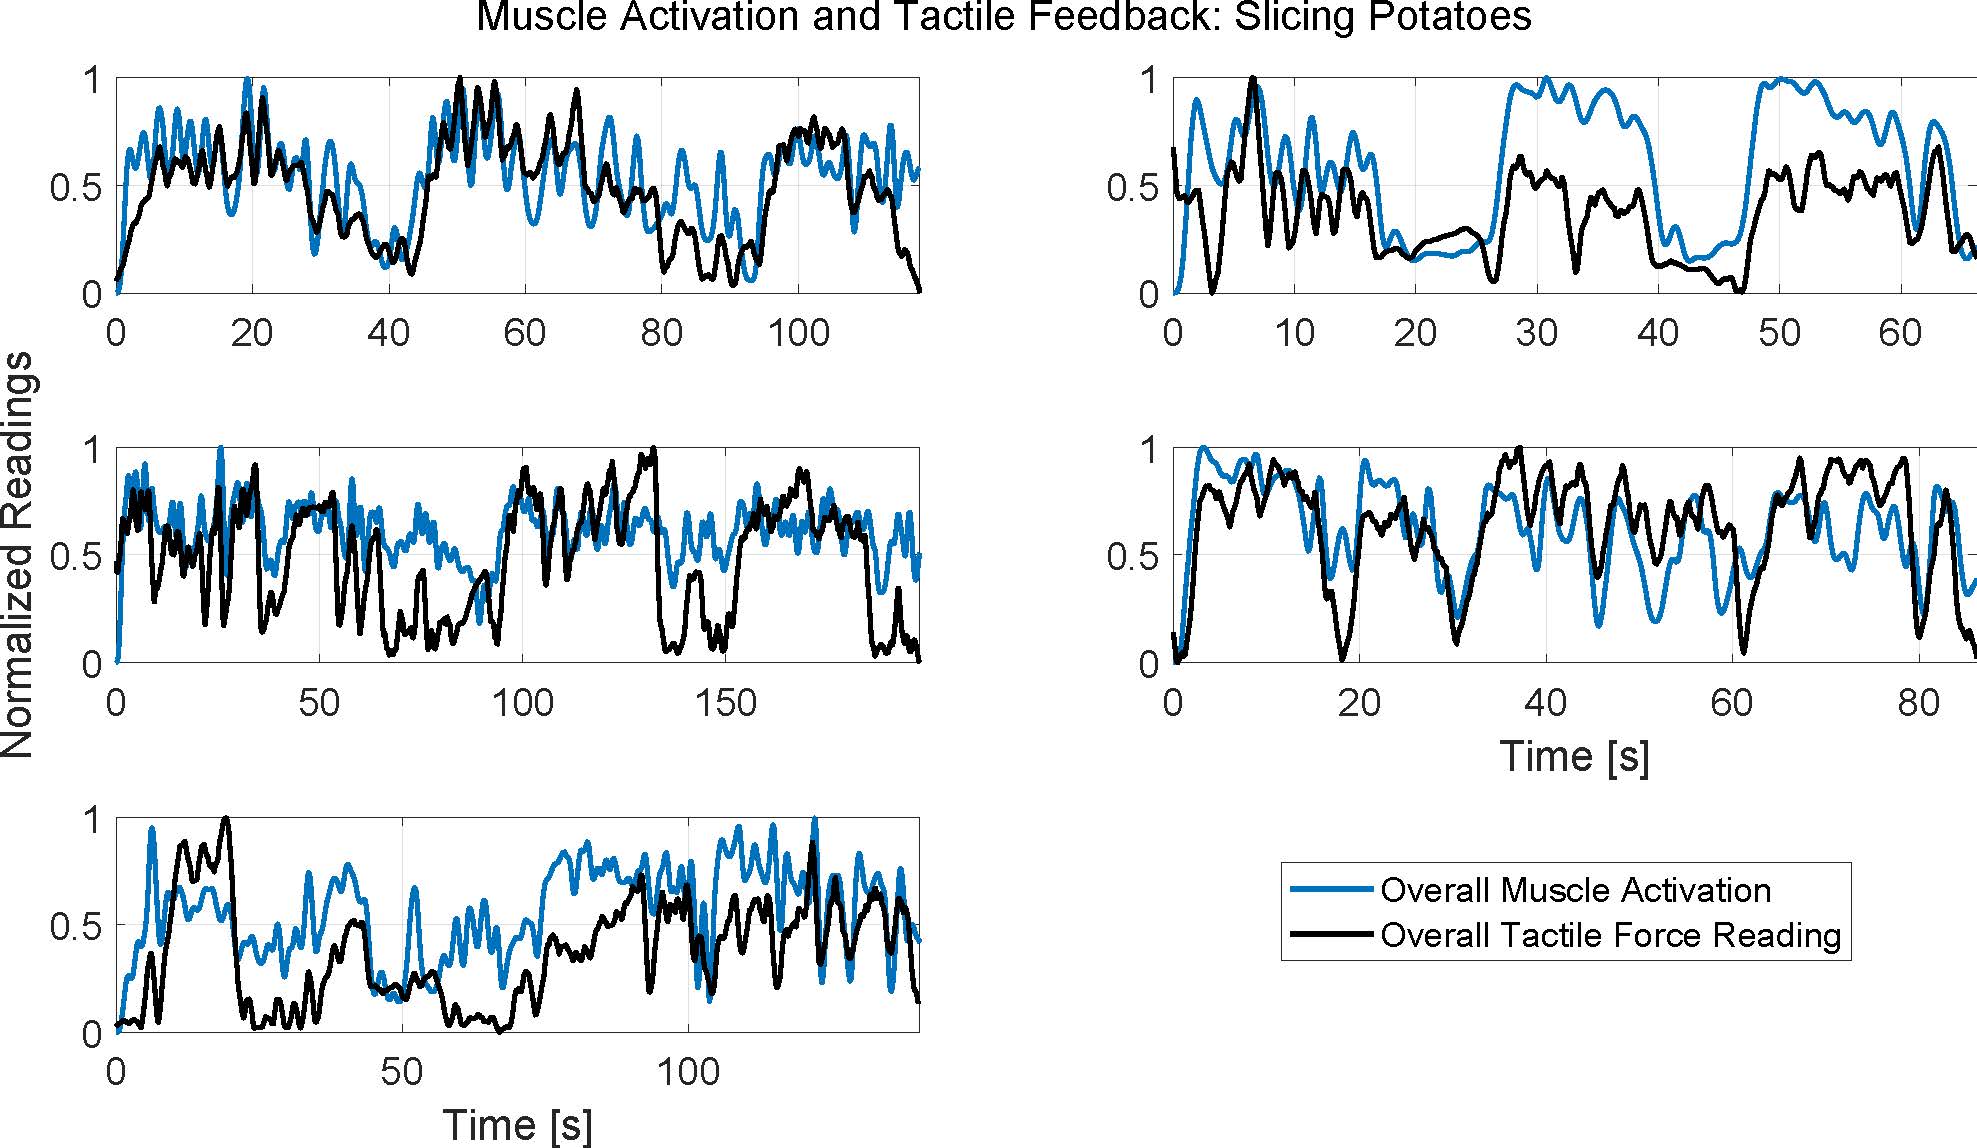
Each subplot represents data from a different subject. Three potatoes were completely sliced during the duration of each subplot.
Each subplot in the above figures presents data from a different subject, and thus spans a different duration depending on how long the subject took to perform the task.
It can be seen that the muscle activity and hand pressure readings generally have similar overall trends and peak locations. The correlation coefficient averaged 0.66±0.12 for slicing cucumbers, and 0.61±0.05 for slicing potatoes. While more evaluation will be required to investigate this further, these correlations and qualitative results suggest that information from one modality contains useful information about the other modality, opening the possibility for using a sensor to predict data other than its directly intended stream.
As expected though, the correlation is not perfect since the modalities are fundamentally measuring different aspects of the person's activity; this therefore confirms that there is also valuable information to be gleaned by having both modalities present. Depending on the task, this can help inform which modality to select or how best to combine the streams in a learning pipeline.
In addition to comparing the two modalities to each other, the signals also suggest valuable information about the task. Each subplot spans three iterations of the activity, i.e. slicing three cucumbers or three potatoes. For many of the subjects, these three segments can be clearly identified by inspection of the overall activation trends; for other subjects, these may be clouded by intermediary tasks such as clearing the cutting board. Furthermore, the peaks within each iteration may represent individual slicing actions. It can be seen that the number of slices was variable between subjects, but that there was typically a consistent cadence to the activity. The potato slices are often more salient than cucumber slices, which may be related to the vegetable hardness, the required technique, or the amount of practice the subjects had wearing the sensors since potatoes were always sliced after cucumbers.
The preliminary exploration thus suggests that the data may facilitate automatic labeling and fine-grained action segmentation. Future investigations can explore this more rigorously, such as by adjusting the filtering to highlight the desired peaks, by augmenting the analysis with additional data streams such as audio to hear when the knife contacts the table, or by comparing with manually annotated video data.